
Key Findings
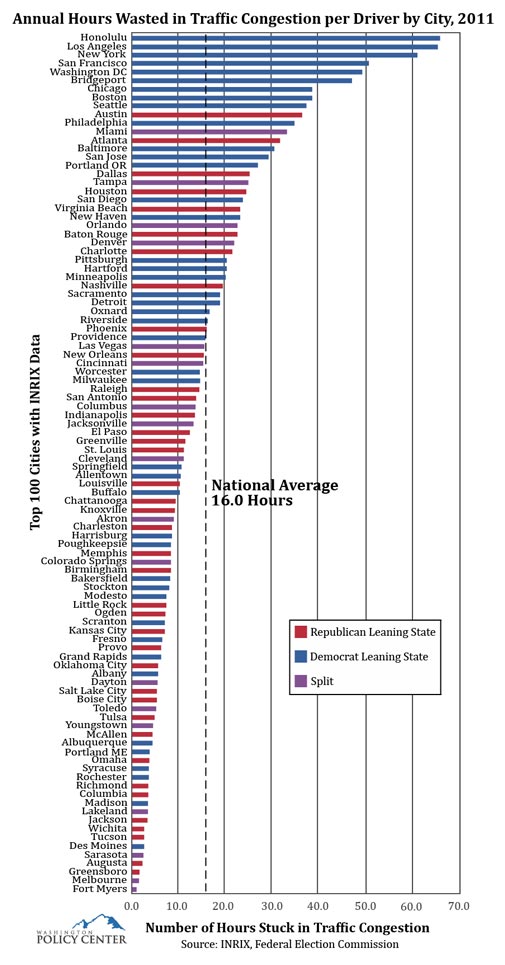
- Nine of the top ten cities with the worst traffic delay in America are in blue states: (1) Honolulu; (2) Los Angeles; (3) New York City; (4) San Francisco; (5) Washington, D.C.; (6) Bridgeport, Conn.; (7) Boston; (8) Chicago; and (9) Seattle.
- Among the cities with above-average delay, 64% are in blue states and 25% are in red states.
- Drivers in blue states waste an average of 21.6 hours in traffic annually while drivers in red states waste an average of 11.6 hours.
- Among the cities with below-average delay, nearly half are in red states and only 31% are in blue states.
- Drivers from cities in blue states waste 931 hours in traffic congestion annually, while drivers from cities in red states waste 451 hours.
Introduction
Traffic congestion is a serious problem in major cities across the country. INRIX, an international traffic data firm in Seattle produces a National Traffic Scorecard that ranks the top 100 metro cities based on hours wasted in traffic congestion. In 2011, drivers in these cities wasted an average of 16.0 hours per year in traffic congestion.
Most Americans believe mobility is essential to their quality of life and that traffic congestion stands in the way. Traffic congestion accounts for higher energy consumption and lost productivity, and it increases the price of consumer goods. But do politics play a role in how much a state works to reduce traffic congestion? Is there a connection between how many hours drivers waste in traffic congestion and a state’s political party preference?
Washington Policy Center overlaid the INRIX data with whether a state leans Republican or Democrat and it revealed an interesting pattern. The following table compares how many hours drivers are stuck in traffic congestion with red and blue states in the top 100 cities in America.
Methodology
States were categorized by their electoral voting record during the past four presidential elections. States that voted Republican during three or more of the last four presidential elections are defined as red. Likewise, states that voted Democratic during three or more of the last four presidential elections are defined as blue. States that voted Republican twice and Democratic twice are defined as purple.
However, correlation is not always causation. Cities and states each have unique circumstances that define their own transportation policies. The patterns shown are interesting, but there are many other factors that influence traffic congestion in specific metropolitan areas. More analysis must be done before any definitive conclusions are drawn.
Michael Ennis is director of the Center for Transportation at Washington Policy Center, a non-partisan independent policy research organization in Washington state. Melanie Stambaugh is a research assistant as part of WPC’s Doug and Janet True Internship Program.
Download a PDF of this Policy Note here.
Download a full-resolution version of the chart here.